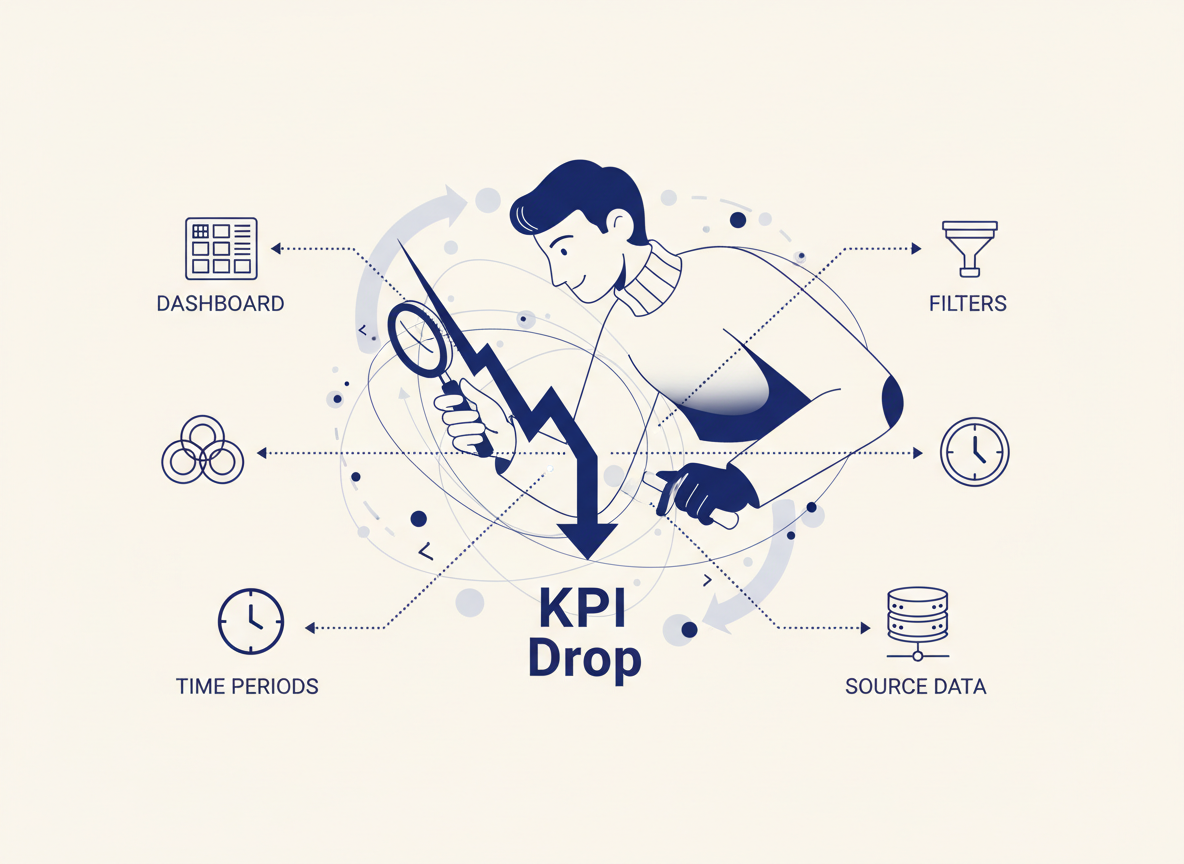
When a KPI suddenly drops, do not start with a business story. First establish whether the change is real, measurable, and concentrated.
1. Confirm the symptom
Check refresh time, source freshness, latest available date, row counts, and the underlying table. A dashboard can be stale while the business is fine.
2. Check measurement changes
Look for changed filters, joins, exclusion rules, renamed fields, schema changes, failed jobs, and late-arriving data. The measurement itself may have changed.
3. Use comparable periods
Day-over-day comparisons can mislead when weekdays and weekends behave differently. Compare like-for-like periods and inspect the broader trend.
4. Segment the movement
Break the KPI by product, region, channel, device, supplier, customer segment, or another meaningful dimension. Concentration often narrows the investigation.
5. Test explanations
A variable changing at the same time is a clue, not proof of causation. Check timing, mechanism, and whether the relationship persists in other segments or periods.
6. Quantify impact
Translate percentages into affected volume, duration, and business exposure. A small percentage change on a huge base can matter more than a dramatic change on a tiny base.
2 responses to “How to Investigate a Sudden Drop in a Dashboard Metric”
[…] How to Investigate a Sudden Drop in a Dashboard Metric […]
[…] with how to investigate a sudden drop in a dashboard metric, review 10 data validation checks before reporting, or read how to document analytics requirements […]