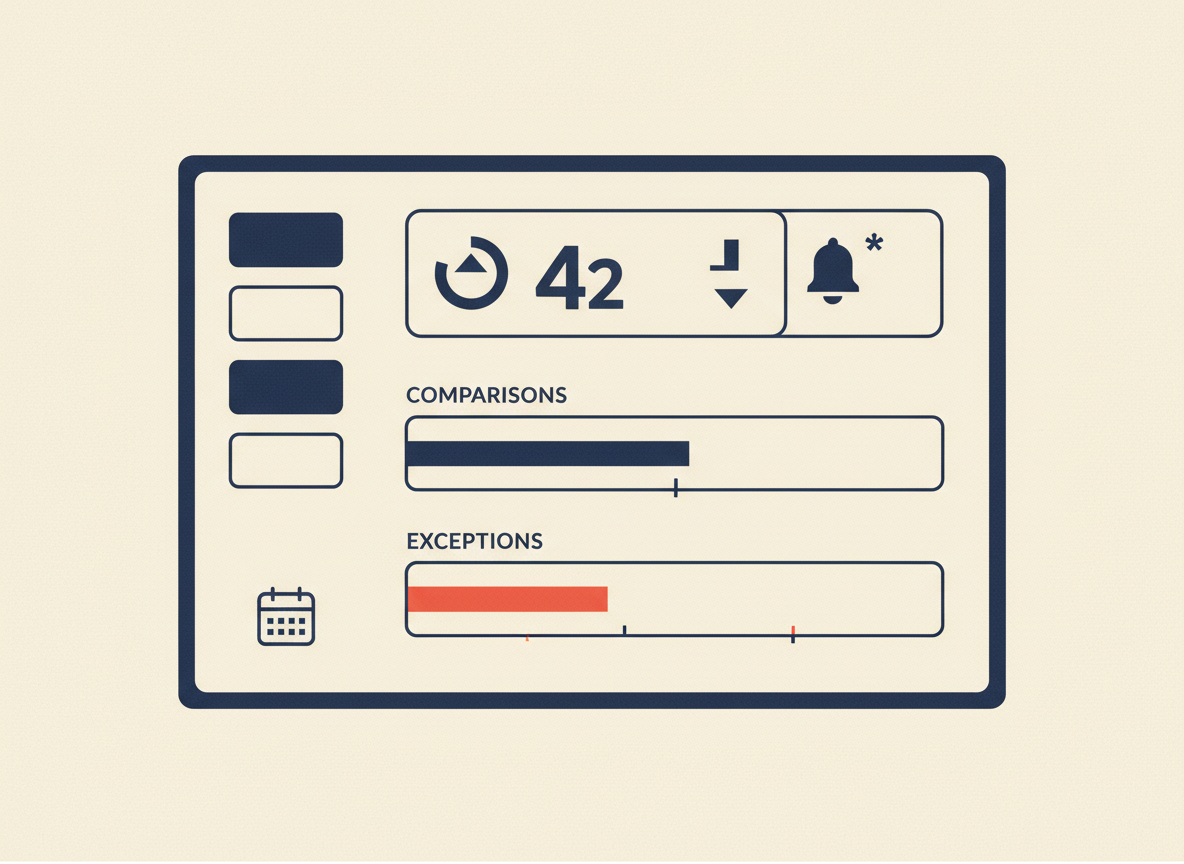
The first screen of a Power BI dashboard should help a user understand the current situation quickly and decide what to inspect next.
Start with the user’s decision
Identify who uses the dashboard, how often, and what decision they need to make. The first screen should serve that decision, not the analyst’s desire to show every chart.
Create hierarchy
A useful structure is headline KPIs, trend or comparison, major drivers, then exceptions. Equal-sized visuals make prioritization harder.
Make KPI cards contextual
Show the current value with a useful comparison such as prior period, target, or baseline. Make the metric definition discoverable.
Use charts for comparisons
Choose a chart because it makes a comparison easier. If a table is clearer, use a table. Visual variety is not a business requirement.
Design for exceptions
Operational dashboards should make unusual values visible through thresholds, exception tables, conditional formatting, or drill-through paths.
Keep filters purposeful
Start with filters that materially change the decision: date, product, region, business unit, or customer segment. Avoid turning the first screen into a control panel.
First-screen checklist
Can users find the main KPI immediately? Is the comparison clear? Can they see the trend, drivers, and exceptions? Can they drill into detail?
One response to “Power BI Dashboard Design: What to Put on the First Screen”
[…] Power BI Dashboard Design: What to Put on the First Screen […]